Download full case study (PDF)
Overview
Goal: Analyze influenza season trends across the United States to identify hospital staffing needs.
Role: Data Analyst
Timeline: 2 weeks
Tools: Tableau, Excel
Process
Research
- Collected U.S. influenza case data by region and week.
- Explored seasonality patterns in hospital admissions.
- Benchmarked staffing capacity against peak flu season demand.
Design / Implementation
- Cleaned and structured raw data in Excel.
- Built interactive Tableau dashboards and a storyboard for stakeholders.
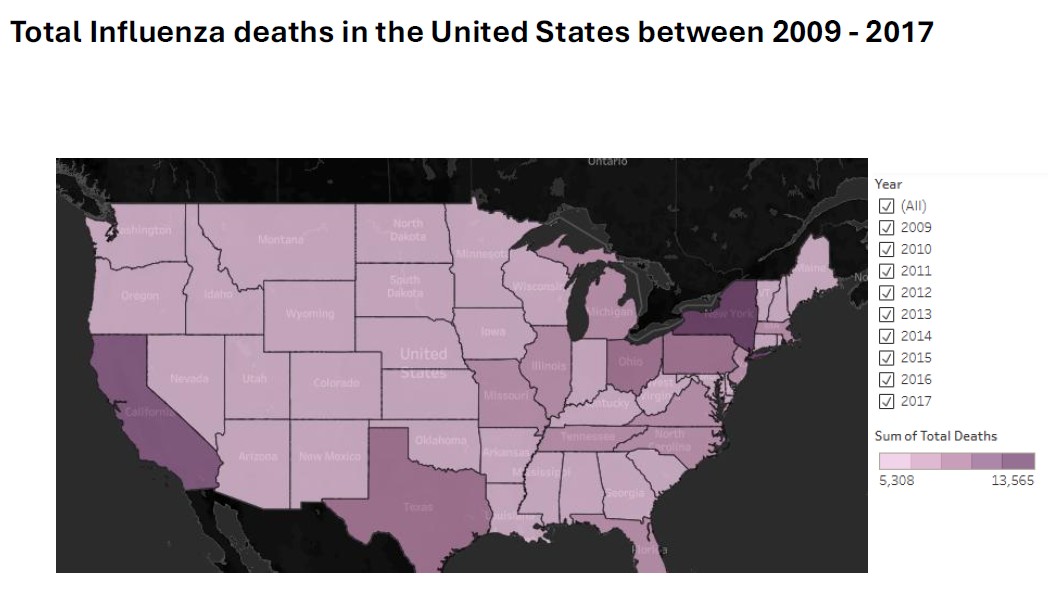
- Created choropleth maps and weekly trend visualizations.
Testing / Results
- Identified staffing shortages in key states during peak weeks.
- Validated storyboard usability with peer feedback.
Outcome
The storyboard provides hospital administrators with actionable insights to adjust staffing levels during flu season. Future improvements include integrating real-time CDC data and expanding dashboards to cover multiple years.